- Joined
- Apr 25, 2012
- Messages
- 1
- Reaction score
- 0
Hey guys,
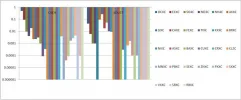
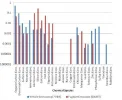
So I'm working with values of less than 1, so obviously the log of anything less than 1 is a negative number. However, when I change a charts Y axis to log scale, all I want is the scale to be in log form. I don't want it computing the logs of my data and seeing that the log of say, .4 , is negative and thus flipping the graph. I have attached a photo of what this currently looks like. If I have been unclear on anything, let me know and I will try to clarify.
Using 2007.
Thanks
SO
Attachments
Last edited:


