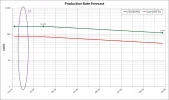
I've written a series of VBA subs to generate a time series line plot in excel with the horizontal axis being a date axis and the value axis scale logarithmic. The horizontal axis scale is in months, the major unit scale is 6 months, and the minor unit scale is 3 months. Everything has worked out great except that for some reason when I try to add and format the minor gridlines, they don't all show up. I am attaching a screenshot of the plot that shows what I'm talking about. Does anyone have an idea as to why one or more of the minor gridlines do not show up? I have used a lot of code to generate the plot (including a forms sheet for inputs). I'll also attach the data series columns used to make the plot in the image. I realize it's not a huge issue, but I'm pretty frustrated by it nonetheless. Thanks in advance.
Brandon
Brandon

